Results
Financial review in 2018
Financial Key Performance Indicators (KPIs)We use the following financial and operational KPIs to track Orange Polska’s performance
| KPI | 2018 Outlook and guidance |
Performance | 2019 Outlook and guidance |
|---|---|---|---|
|
Adjusted Revenue (In PLN millions) |
Supported by national
roaming contract with Play Further focus on convergence strategy Legacy revenue (PSTN, wholesale) in continued structural decline |
|
Growth vs 2018 Further focus on convergence and value strategy Legacy revenue (PSTN, wholesale) in continued structural decline but at a diminishing pace |
|
Adjusted EBITDA/ EBITDAaL* (In PLN millions) |
Around PLN 3.0 billion stable vs 2017 (under IAS18 accounting standard and around PLN 2.75 billion under IFRS 15 accounting standard) |
|
EBITDAaL* growth versus 2018 (2018 comparable base: PLN 2,811mn`) |
|
Adjusted CAPEX (In PLN millions) |
Around PLN 2.0-2.2 billion, including around 0.7-0.8 billion on fibre rollout (c.1m new households connectable in fibre) |
|
Around PLN 2.0-2.1bn, including 0.7-0.8 bn on fibre rollout (0.8-0.9m new households connectable in fibre) |
|
Adjusted Organic Cash Flow (OCF) (In PLN millions) |
 |
||
|
Net debt/ adjusted EBITDA |
Not higher than 2.6x including potential EC fine payment (Under IAS18 accounting standard and not higher than 2.8x under IFRS15 accounting standard) |
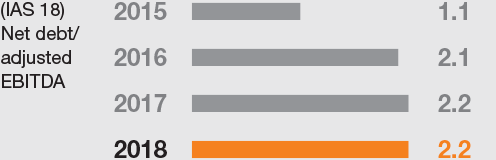 |
Net debt /EBITDAaL* Decreasing on comparable basis (2.4x in 2018) |
|
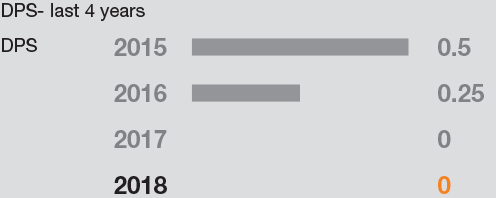
Dividend Per Share (DPS) (PLN) |
Having decided to prioritise investments in long-term value creation and also taking into account potential payment of EC fine, Orange Polska management will recommend not paying any dividend in 2018 (in line with statements during September 2017 strategy presentation) |
|
As we prioritise investments in long-term value creation and also taking into account uncertain outlook regarding 5G spectrum allocation, the management will not recommend paying any dividend in 2019 (in line with what was stated during strategy presentation in September 2017) |
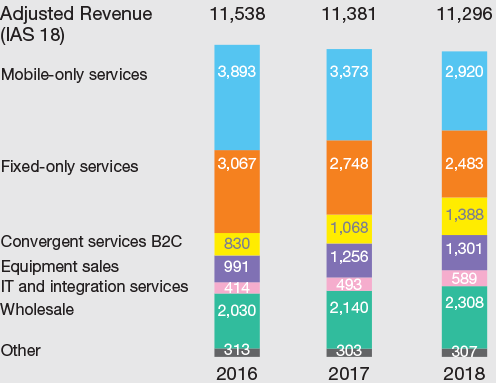
Revenue evolution improves driven by convergence
In 2018, we changed the layout of our revenue reporting. The new layout better reflects our commercial strategy, which is focused on convergent offer sales. Consequently, we now report convergent revenues separately from revenues from mobile-only and fixed-only services (i.e. sales to non-convergent customers).
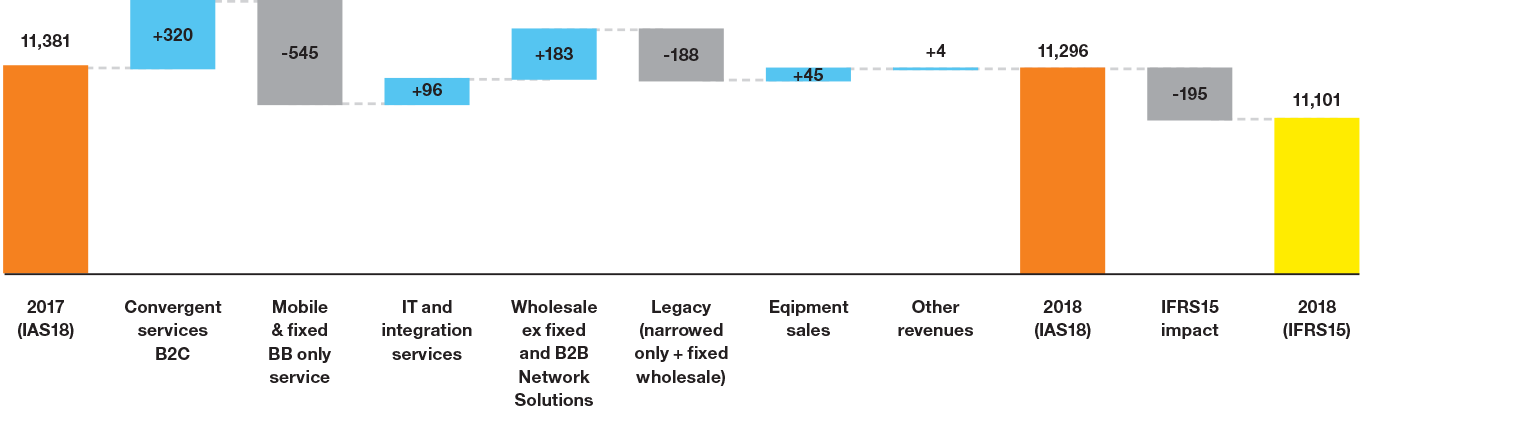
Revenues (under IAS18 accounting) totalled PLN 11,296 million in 2018, down PLN 85 million or 0.7% year-on-year.
The rate of decline was much lower than in 2017 (when revenues fell 1.4%). The trend improvement may be attributed mainly to the following factors:
- strong growth of convergence revenues, driven by customer base expansion and ARPU stabilisation;
- a lower decline in fixed-only services, mainly as a result of stabilisation of revenues from network solutions for business customers;
- an almost 8% increase in wholesale revenues, benefitting mainly from a national roaming contract with Play and growth in international interconnect.
However, it is important to underline that the improving growth rate of convergent service revenues increasingly offsets the decline of mobile-only and fixed broadband-only revenues. Combined revenues from these categories were down 4.1% yearon-year in 2018, as compared to 6.5% year-on-year decline in 2017. In 2018 average revenue per convergent offer declined by approximately 4% year-on-year. This decline was much lower than in 2017, when it fell by 12%. The improvement in the trend is attributable to successful upsell of additional services and proper value management in pricing our Orange Love offer.
Blended ARPO from mobile-only services amounted to PLN 21.6 in 2018 and was down 6% (year-on-year). The decrease resulted from a combination of an improvement in pre-paid ARPO and an approximately 10% decline in post-paid ARPO.
The post-paid ARPO decline was lower than in 2017, when it amounted to 13%. The decline can be attributed to the following factors:
- growing take-up of SIM-only offers;
- popularity of family offers, in which customers get several SIM cards and which involve price discounts;
- substantial decrease in mobile broadband ARPO, resulting from much lower take-up of this service;
- price competition.
Adjusted revenue evolution (y-o-y change, in PLN millions)
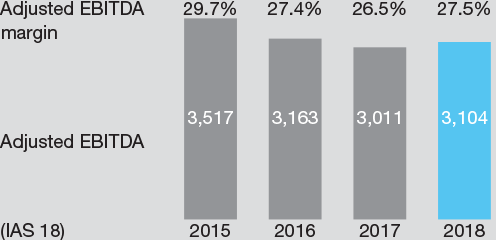
2018 adjusted EBITDA (under IAS18 accounting) grows for the first time in 12 years and proves our strategy is being executed well in a challenging environment
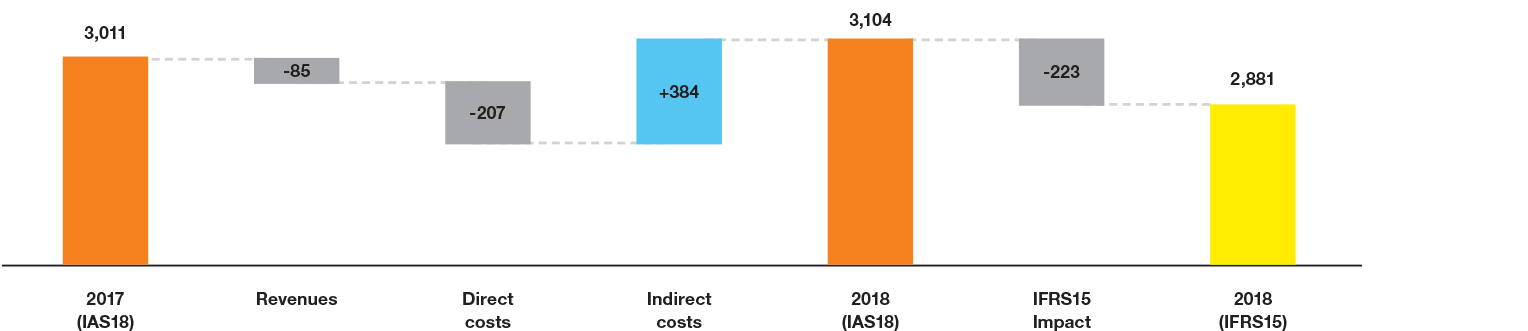
Total operating costs (defined as adjusted EBITDA less revenues) fell by 2.1% year-on-year. As the decrease exceeded revenue erosion, adjusted EBITDA increased by 3.1%. It should be emphasised that this is the first time in twelve years that Orange Polska has reported adjusted EBITDA growth. The adjusted EBITDA margin stood at 27.5% and was up 1.0pp year-on-year. The margin improved despite continued structural pressure on high-margin traditional fixed line services (mainly fixed line voice services), as any decrease in these services is almost entirely reflected in profit erosion. The margin improvement was a result of the convergence strategy implementation, monetisation of fibre investments, focus on value creation, considerable optimisation of operating costs and higher gains on disposal of assets.
Cost evolution can be attributed mainly to the following factors:
- a decrease of 6.3% in commercial expenses, resulting mainly from the lower volume of customer acquisition and retention transactions bundled with handsets, as well as optimisation of the distribution channel mix and significant savings in advertising and promotion costs;
- a decrease of 7% in labour costs, mainly owing to workforce optimisation related to the implementation of the new Social Agreement;
- a decrease of approximately 7% in network and IT expenses, resulting from savings in energy consumption, network maintenance and installation costs;
- an increase of 8% in other external purchases, driven by purchase costs of energy for further resale (related to higher revenues in this segment) and content costs (resulting from TV customer base expansion). The increase in these cost items exceeded savings generated mainly in real estate maintenance and general administration costs.
Adjusted EBITDA evolution (y-o-y change, in PLN millions)
Bottom line evolution reflects much higher reported EBITDA
Net income for 2018 stood at PLN 190 million (under IAS18 accounting) versus a net loss of PLN 60 million in 2017. Significant improvement is mainly a consequence of much higher reported EBITDA which in 2017 was affected by provisions related to Social Agreement PLN 204 million). Net financial expense was at a similar level to 2017. Higher income tax is a consequence of higher pre-tax profit and also higher non tax-deductible costs.
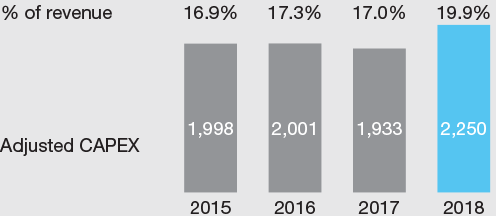
2018 capex at its peak and consistent with strategy
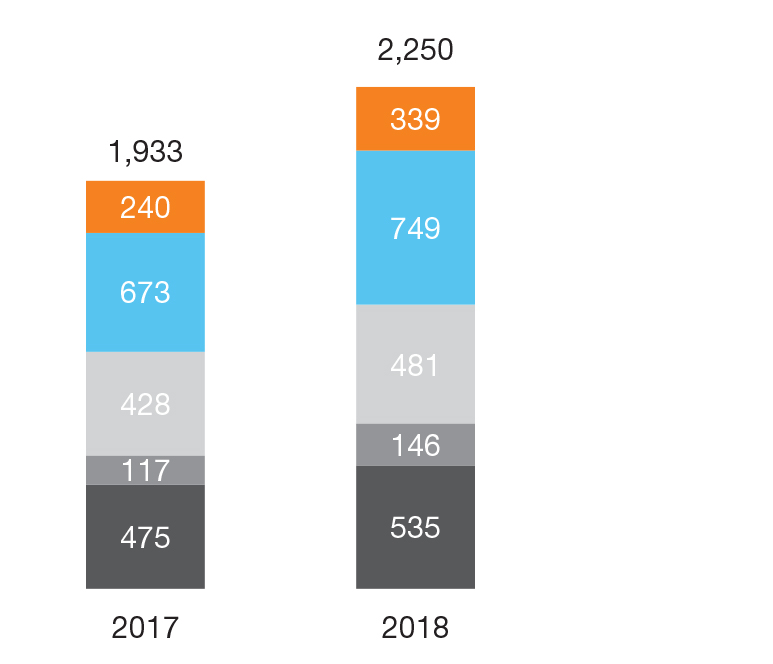
In 2018, Group’s adjusted capital expenditure amounted to PLN 2,250 million and was higher by PLN 317 million year-on-year. The majority of the growth was related to connectivity investments that are essential to the success of our strategy.
The Group invested mainly in the following areas:
- rollout of the fibre access network as part of the planned investment programme, which covered 0.9 million households in 2018 (including the lines developed in 2014 to 2017, there are now almost 3.4 million households connectable within the fibre network, available in a total of 117 cities compared to 75 cities at the end of 2017);
- investments to enhance the range of LTE services and the quality of the mobile network, expand the capacity and range of GSM/UMTS services, and adapt the mobile access network to the 4G technology requirements, particularly in areas not covered by the mobile access network consolidation project (i.e. strategic or underinvested regions);
- expansion of the mobile transport and core network in order to handle the growing volume of data transmission and ensure the service quality expected by customers;
- implementation of IT transformation programmes, including a common system for handling fixed-line and mobile service sales to B2C and SOHO customers;
- investment projects related to portfolio development and sales and customer service processes as well as the modernisation and enhancement of the IT technical infrastructure.
|
Mobile Network
FTTH program (incl. CPE) Other network (optical, convergent, core) Customer Premise Eqipment (CPE: excl. FTTH) IT Systems and Infrastructure and others |
 |
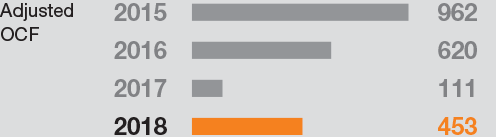
Adjusted Organic Cash Flow improves thanks to better working capital and higher EBITDA
Adjusted organic cash flow for 2018 came in at PLN 453 million and increased significantly versus PLN 111 million in 2017. The most significant factor behind this improvement was the receipt of PLN 275 million from T-Mobile related to the wholesale agreement signed in July. Organic cash flow was also supported by better operating cash flow (resulting from higher EBITDA and lower working capital requirement) and proceeds from disposal of assets (up by PLN 43 million year-on-year). Capital expenditure cash outflows were PLN 2,161 million in 2018, up PLN 95 million year-on-year, as a result of higher capex.
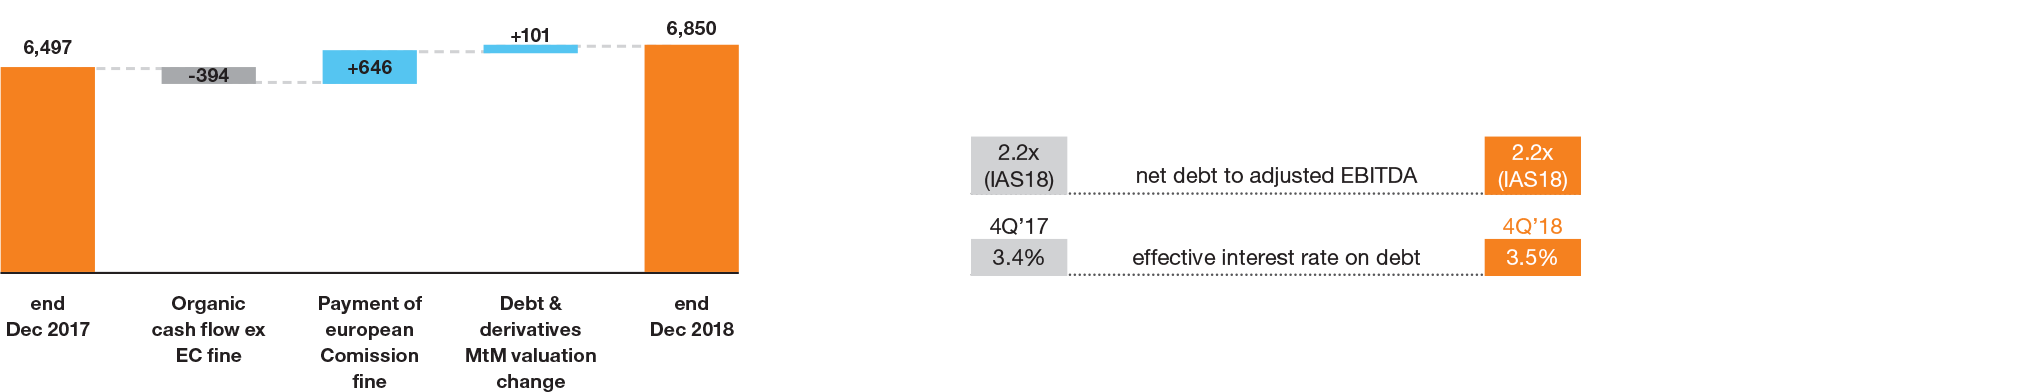
Leverage ratio at 2.2x
Our net debt in 2018 increased by around PLN 0.35 billion to PLN 6.85 billion, mainly due to the payment of a European Commission fine. Despite higher debt, the leverage ratio remained unchanged at 2.2x at the end of 2018, as higher debt was offset by growth of EBITDA. Our debt was fully hedged against currency movements and we increased the share of debt based on a fixed interest rate, to 93% from 78% at the end of 2017, as we anticipate higher interest rates in the future.
Net debt evolution (in PLN millions)
Management proposes no dividend payout in 2019
In line with our statements during the Orange.one strategy presentation in September 2017, the management will once again recommend not paying a dividend in 2019. On the one hand, we will continue to invest in our fibre network rollout at full speed. On the other hand, we still await clarity regarding the outlook for 5G spectrum allocation.
Application of IFRS16 in Orange Polska
From 2019, Orange Polska will report its financial results under the new accounting standard IFRS16. The key objective of the new standard is to provide a single accounting method for all lease contracts. All contracts currently defined as finance leases or operating leases will be accounted for in the same way as finance leases are today. In the P&L, expenses related to operating leases - currently booked as operating costs - will be booked below EBITDA under IFRS16 (as amortisation of the right of use and lease interest expense). The implementation of IFRS16 does not change the business fundamentals and sources of our value generation. In our view, expenses related to leasing contracts are part of operating activity and operating profitability. Therefore we decided to create an alternative performance measure to report operating profitability under IFRS16. It is called EBITDAaL, which stands for EBITDA after leases. EBITDAaL will add back in the right-of-use amortisation and lease interest expense related to both finance and operating leases. In our view, EBITDAaL will more accurately reflect the way the Company is managed internally, compared to EBITDA derived directly from the IFRS16 income statement.
EBITDAaL under IFRS16 is quite similar to EBITDA under IFRS15. The differences relate to: (1) impact of contracts previously accounted for as finance leases and (2) IFRS16 impact of discounting effect on contracts previously accounted for as operating leases. The EBITDAaL approach has a minor impact on other alternative performance measures: capex, net debt and organic cash flow.
Including finance leases in EBITDAaL as operating costs requires that finance leases are no longer part of capex and net debt. On the other hand our organic cash flow definition will now include payments of finance lease liabilities. These were previously included in repayments of financial debt.
In the table below we provide our estimate for EBITDAaL for 2018 in order to provide a comparable base for performance in 2019.
(in PLN millions)